In the modern enterprise, manual report generation is a significant bottleneck. It consumes valuable hours, is prone to human error, and delays critical decision-making. The process often involves pulling data from disparate sources like Salesforce, financial systems, and operational databases, then manually compiling it into spreadsheets or presentations. This repetitive, low-value work prevents skilled professionals in IT, finance, and operations from focusing on strategic analysis. The solution lies in dedicated report automation tools designed to streamline this entire workflow.
This guide provides a comprehensive breakdown of the leading platforms available today. We move beyond generic marketing claims to offer an in-depth analysis of 12 top-tier tools, from powerful business intelligence platforms like Power BI and Tableau to specialized solutions like EDocGen and Coupler.io. For each tool, we provide a detailed look at its core functionality, ideal use cases, specific integrations, and practical implementation considerations. This resource is built to help you quickly identify the right platform for your specific business needs, whether you are an IT team at a mid-sized bank, a compliance officer in the life sciences, or a business operations manager in a large corporation.
Our goal is to equip you with the practical insights needed to compare options effectively and select a tool that will deliver tangible results. Now, let’s explore the platforms that can transform your reporting processes.
EDocGen solidifies its position as a premier enterprise-grade solution for document and report automation tools , distinguishing itself with a powerful no-code interface and profound integration capabilities. Designed for business users, not just developers, the platform empowers departments like HR, finance, and legal to transform complex data from JSON, XML, or databases into polished, branded documents. This approach democratizes the automation process, allowing teams to independently manage and deploy sophisticated reporting workflows without ongoing IT intervention.
Its core strength lies in its ability to handle high-volume, logic-driven document generation with exceptional speed and accuracy. From financial statements and insurance policies to compliance reports and personalized client communications, EDocGen's engine processes thousands of documents in minutes. This makes it an ideal choice for enterprises where efficiency, scalability, and brand consistency are non-negotiable.
EDocGen's architecture is built for flexibility and security, addressing key enterprise requirements head-on. A centralized template repository ensures all generated reports adhere to strict brand guidelines and regulatory standards, while robust access controls govern who can create or modify templates.
Financial services firms leverage EDocGen to automate the generation of monthly client portfolio statements, integrating directly with their core banking systems. In the insurance sector, it accelerates policy and claims document creation, significantly reducing processing times. For a more detailed exploration of its applications, you can learn more about document generation tools on edocgen.com .
Key Details & Use Cases
|
Strengths |
Limitations |
|
No-code interface empowers business users to create complex templates without developer support. |
Pricing is not public and requires a direct inquiry. |
|
Ultra-fast bulk generation is ideal for high-volume enterprise reporting and communication. |
Highly customized or legacy system integrations may still require some technical aid. |
|
Cloud-agnostic and on-premises deployment options provide ultimate IT environment flexibility. |
|
|
Centralized template management ensures brand compliance and governance across the organization. |
EDocGen is a formidable platform for any enterprise seeking to master its reporting and document workflows. Its blend of user-friendly design, powerful automation capabilities, and enterprise-grade security makes it a strategic asset for achieving operational excellence and digital transformation. While pricing requires a custom quote, the ROI from reduced manual effort and accelerated processes presents a compelling business case.
Website: https://www.edocgen.com
Coupler.io distinguishes itself as a premier no-code data integration platform, specifically designed for teams that need to automate data consolidation without deep technical expertise. Its primary function is to serve as a robust data pipeline, pulling information from over 70 different marketing, sales, finance, and project management applications directly into destinations like Google Sheets, Microsoft Excel, Looker Studio, or Power BI. This makes it an ideal choice for departments that rely heavily on spreadsheets for their analysis but struggle with the manual, error-prone process of data collection.
The platform’s standout feature is its simplicity and accessibility. Users can schedule automatic data refreshes to run as frequently as every 15 minutes, ensuring reports are always based on the most current data. While it isn't a full-fledged BI tool with advanced visualization capabilities, it excels at the crucial first step of data aggregation and light transformation, such as filtering, sorting, and combining data from multiple sources.
Looker Studio, formerly known as Google Data Studio, is Google's powerful and free tool for transforming raw data into fully interactive, easy-to-read dashboards and reports. It excels at visualization, allowing users to create compelling reports from a multitude of data sources without writing any code. Its greatest strength lies in its seamless, native integration with the Google ecosystem, making it the go-to choice for businesses deeply invested in Google Analytics, Google Ads, BigQuery, and Google Sheets.
The platform is designed for accessibility, featuring a drag-and-drop interface that empowers users to build sophisticated reports with various charts, tables, and scorecards. One of its core functions is the ability to schedule automated report delivery via email, ensuring stakeholders receive timely updates. While it's a visualization-first tool, it serves as a critical component in many organizations' report automation tools stack, particularly for creating client-facing or internal performance dashboards that need to be live and interactive.
Microsoft Power BI stands as a titan in the business intelligence space, offering a comprehensive suite of tools that empower users to connect to, model, and visualize data for in-depth analysis. It is designed to scale from individual analysts to entire enterprises, making it one of the most versatile report automation tools available. Its core strength lies in its ability to transform raw data from hundreds of sources into interactive, visually immersive dashboards that provide actionable insights. This makes it a go-to choice for organizations already invested in the Microsoft ecosystem.
The platform is much more than a simple report generator; it is a full-fledged analytics engine. Power BI allows for the creation of complex data models, custom calculations using the DAX formula language, and the setup of automated data refreshes to ensure reports are always current. Users can build everything from simple operational dashboards to sophisticated financial and sales performance reports, all of which can be securely shared across the organization.
Tableau stands as a titan in the business intelligence and data visualization space, enabling organizations to transform raw, disparate data into actionable insights through stunning interactive dashboards. It excels at connecting to a vast array of data sources, from simple spreadsheets and cloud apps to complex databases like SQL Server and cloud warehouses like Snowflake. Its core strength lies in empowering users to visually explore data, uncover trends, and create compelling narratives without writing code.
While primarily known for visualization, Tableau is a powerful report automation tool. Users can set up live connections or scheduled data extracts to ensure dashboards are always up-to-date. This eliminates the manual effort of rerunning reports, allowing stakeholders to access real-time or near-real-time analytics on demand. Features like the AI-driven "Ask Data" allow non-technical users to query complex datasets using natural language, further democratizing data access.
Databox operates as an agile, real-time KPI dashboard and business analytics platform, purpose-built for teams that need to visualize performance data instantly. It excels at consolidating metrics from over 70 popular services, including Google Analytics, HubSpot, and Salesforce, into clean, interactive dashboards. This focus on immediate visual feedback makes it a go-to tool for marketers, sales teams, and executives who need to track progress against goals without waiting for manual report assembly.
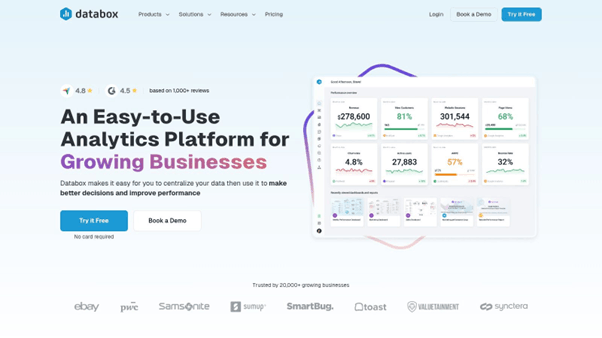
The platform’s core strength lies in its user-friendly, no-code environment. Users can leverage a drag-and-drop builder and a vast library of pre-built templates to create comprehensive dashboards in minutes. Key features like automated performance alerts, goal tracking, and scheduled report delivery via email or Slack make it one of the more accessible report automation tools for teams that prioritize speed and ease of use over complex data manipulation.
Swydo carves out a specific niche within the landscape of report automation tools by focusing almost exclusively on the needs of digital marketing agencies. It is a dedicated reporting, monitoring, and workflow platform designed to streamline how agencies communicate performance results to their clients. The core value proposition is automating the creation and delivery of professional, white-labeled client reports, pulling data from essential marketing channels like Google Ads, Facebook Ads, and Google Analytics.
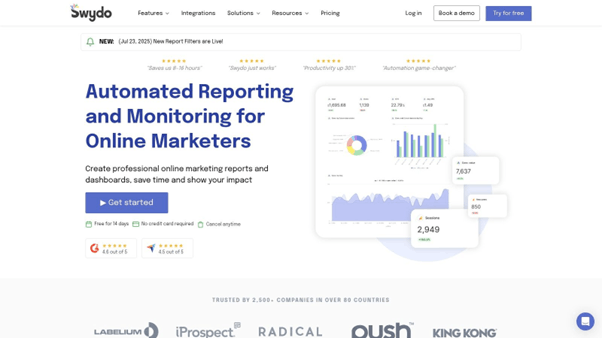
The platform shines in its ability to manage multiple clients from a single, organized dashboard, each with its own workspace, integrations, and reporting schedule. Its strength lies not in complex data transformation but in presentation-layer automation. Users can build report templates, set up KPIs with performance alerts, and schedule recurring reports to be sent directly to clients, saving agencies countless hours each month. This agency-centric design makes it a powerful ally for account managers who need to deliver consistent, data-driven updates without extensive manual effort.
DashThis is a highly focused report automation tool built specifically for marketers and digital agencies. Its core strength lies in its simplicity and speed, allowing users to consolidate data from over 34 essential marketing platforms into clean, presentable, and easily shareable dashboards. By eliminating the need to manually log into each platform, screenshot metrics, and compile reports, DashThis directly addresses the most time-consuming aspects of client and internal reporting.
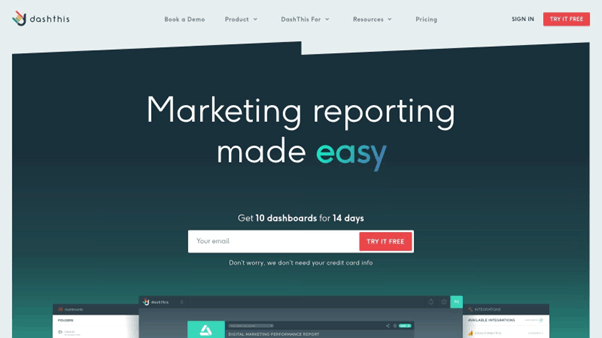
The platform shines with its pre-built report templates and drag-and-drop widgets, which enable users to create comprehensive dashboards in minutes. Features like white-label options are particularly valuable for agencies needing to brand reports for their clients. While it doesn't offer the deep data manipulation capabilities of a full BI suite, it excels as a dedicated solution for turning marketing data into professional, automated reports without a steep learning curve.
AgencyAnalytics is an all-in-one reporting platform built specifically for the unique needs of digital marketing agencies. It streamlines the entire client reporting process by consolidating data from over 75 marketing channels, including SEO, PPC, social media, and email marketing tools. Its core purpose is to eliminate manual report building, allowing agencies to create and schedule professional, white-labeled reports that are sent to clients automatically. This focus makes it one of the best report automation tools for agencies managing multiple client accounts.
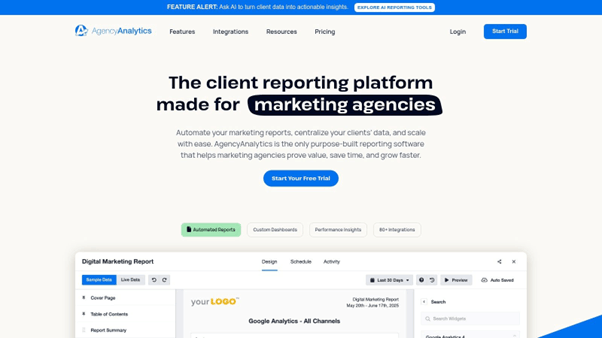
The platform's key strength lies in its blend of automation and customization. Agencies can provide clients with their own secure, branded dashboards for real-time performance monitoring, fostering transparency and trust. Beyond reporting, it includes a suite of built-in SEO tools, such as rank tracking, site audits, and backlink monitoring, adding significant value and reducing the need for separate subscriptions. This combination of reporting and integrated tools makes it a comprehensive client management solution.
Whatagraph is a specialized report automation tool built specifically for marketing agencies and in-house marketing teams. Its core strength lies in its ability to aggregate data from numerous marketing channels and transform it into visually appealing, client-ready reports with minimal effort. The platform automates the entire reporting workflow, from data collection across sources like Google Analytics and Facebook Ads to the scheduled delivery of polished, white-labeled dashboards. This makes it an invaluable asset for professionals who need to communicate campaign performance effectively without spending hours on manual report creation.
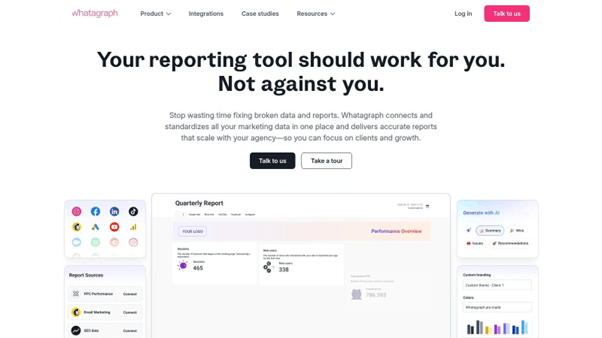
The platform shines with its user-friendly, drag-and-drop report builder and extensive library of pre-built templates, which allow even non-technical users to create comprehensive reports in minutes. Whatagraph’s standout feature is its heavy emphasis on visual storytelling and customization, enabling agencies to deliver reports that reflect their own branding. While other tools may offer broader data source support, Whatagraph’s deep focus on the marketing niche ensures its features are perfectly tailored for campaign analysis and client communication.
Klipfolio is a versatile, cloud-based business intelligence platform that excels at creating real-time, dynamic dashboards for small to medium-sized businesses. It is particularly well-suited for marketing, sales, and finance teams that need to constantly monitor key performance indicators from a wide array of sources. The platform is designed to connect, visualize, and share data, moving beyond static reports to provide live, interactive views of business health.
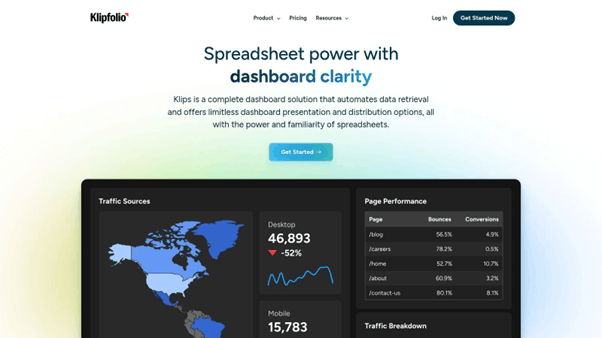
Its core strength lies in its extensive connectivity and customization. With over 100 pre-built connectors to services like Salesforce, Google Analytics, and various databases, Klipfolio simplifies the data aggregation process. Users can then use a powerful editor to build custom visualizations and formulas, tailoring dashboards precisely to their needs. This makes it a strong contender among report automation tools for teams that need more than basic widgets.
Domo is an enterprise-grade, cloud-native business intelligence (BI) platform that goes beyond simple reporting to provide a comprehensive, end-to-end data ecosystem. It is engineered for large organizations that need to connect, analyze, and automate data workflows from a vast and complex array of sources. Domo’s strength lies in its ability to centralize data from cloud systems, on-premise databases, and third-party applications into a single, cohesive environment for real-time analysis.
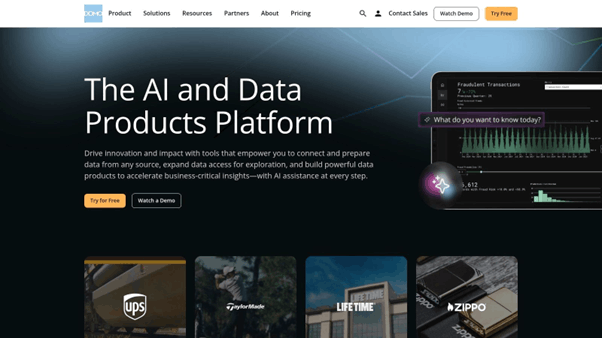
The platform is designed to serve both technical and non-technical users, offering powerful drag-and-drop tools for creating dynamic visualizations and dashboards that refresh automatically. This makes it one of the more versatile report automation tools available, as it supports everything from basic operational reporting to advanced predictive analytics. Its integrated collaboration features also allow teams to discuss insights directly within the platform, tying data directly to business actions.
|
Product |
Core Features |
User Experience |
Value Proposition |
Target Audience |
Price Points |
|
EDocGen |
Multi-format doc generation, no-code, bulk, API integrations, multi-lingual, centralized templates |
Easy no-code template creation, fast bulk processing, brand governance |
Automates complex doc workflows, scalable & secure, rapid ROI |
Enterprises in banking, insurance, real estate, HR |
Contact for pricing |
|
Coupler.io |
70+ data sources, scheduled refresh, data transformation |
User-friendly, no coding required |
Automates data import to spreadsheets, reduces manual work |
Non-technical users needing data consolidation |
Free tier, flexible plans |
|
Looker Studio |
800+ data connectors, drag-and-drop reports, scheduled delivery |
Easy for beginners, Google integration |
Free, interactive dashboarding inside Google ecosystem |
Beginners, marketers, analysts |
Free with Google account |
|
Microsoft Power BI |
100+ data sources, advanced modeling, real-time dashboards |
Robust but steeper learning curve |
Comprehensive BI with Microsoft ecosystem integration |
Business users at all levels |
Free desktop, paid tiers |
|
Tableau |
Wide data sources, advanced visuals, AI-driven queries |
Highly customizable, steep learning |
Deep data analysis and interactive dashboards |
Analysts, enterprises requiring advanced analytics |
Higher cost |
|
Databox |
70+ integrations, customizable dashboards, mobile access |
User-friendly, real-time updates |
Instant KPI monitoring, affordable for SMBs |
Executives, marketers, sales teams |
Free plan, paid tiers |
|
Swydo |
Marketing integrations, white-label reports, multi-client management |
Marketing-focused, automated reporting |
Simplifies agency reporting and client tracking |
Marketing agencies |
Scalable pricing by data sources |
|
DashThis |
34+ platform integrations, white-label, collaboration |
Easy to use, good support |
Saves time with automated marketing reports |
Marketers and small agencies |
Moderate pricing |
|
AgencyAnalytics |
75+ platforms, SEO tools, client portals |
User-friendly, minimal setup |
Streamlines digital marketing agency reporting |
SEO, PPC, social media agencies |
Tiered plans, some features paid |
|
Whatagraph |
Cross-channel data, white-label, report templates |
Drag-and-drop, automation focus |
Visual, client-ready marketing reports |
Marketing teams and agencies |
Higher cost for small teams |
|
Klipfolio |
100+ integrations, real-time monitoring, shared dashboards |
User-friendly but technical at times |
Affordable real-time dashboards for SMBs |
Marketing, sales, finance teams |
Affordable pricing |
|
Domo |
Cloud/on-prem data, real-time dashboards, predictive analytics |
User-friendly drag/drop, scalable |
Enterprise-grade BI with advanced analytics |
Large enterprises |
High cost |
Our comprehensive journey through the landscape of the top report automation tools has revealed a diverse and powerful ecosystem. We've explored everything from dedicated document generation specialists like EDocGen and business intelligence powerhouses like Power BI and Tableau, to dashboard-centric solutions like Databox and agency-focused platforms like Swydo and AgencyAnalytics. The core takeaway is clear: manual reporting is no longer a necessary cost of doing business. The right tool can transform this traditionally time-consuming task into a strategic, automated asset.
By automating the collection, consolidation, and visualization of data, you're not just saving hours of manual labor. You're fundamentally improving the speed and quality of your decision-making processes. Timely, accurate, and consistent reports empower teams to identify trends faster, respond to challenges proactively, and allocate resources more effectively. The shift from creating reports to analyzing them is the ultimate goal of adopting any of these solutions.
Choosing from this list of capable report automation tools can feel daunting. Your decision shouldn't be based on which platform has the most features, but on which one aligns most precisely with your organization's specific needs, existing tech stack, and strategic objectives.
To simplify your selection process, consider these guiding questions:
Selecting a tool is only the first step. Successful implementation is what generates a return on your investment. Before you commit, map out a clear implementation plan.
Ultimately, the goal is to weave these report automation tools into the fabric of your daily operations, creating a reliable and effortless flow of information that fuels your entire organization. By moving beyond manual processes, you unlock your team's potential to focus on what truly matters: deriving actionable insights from your data to drive the business forward.
Ready to automate the most critical documents your business relies on? While many tools focus on dashboards, EDocGen excels at the complex but vital task of generating data-driven, pixel-perfect documents like financial statements, compliance reports, and personalized customer communications at scale. If your reporting needs extend to creating polished, professional documents from your enterprise data, explore how EDocGen can directly solve your report automation challenges.